For division and team leads
Every job in your division and who owns it. Every person’s week, hour by hour. And a quarterly review that flows straight into this month’s plan.
Your day
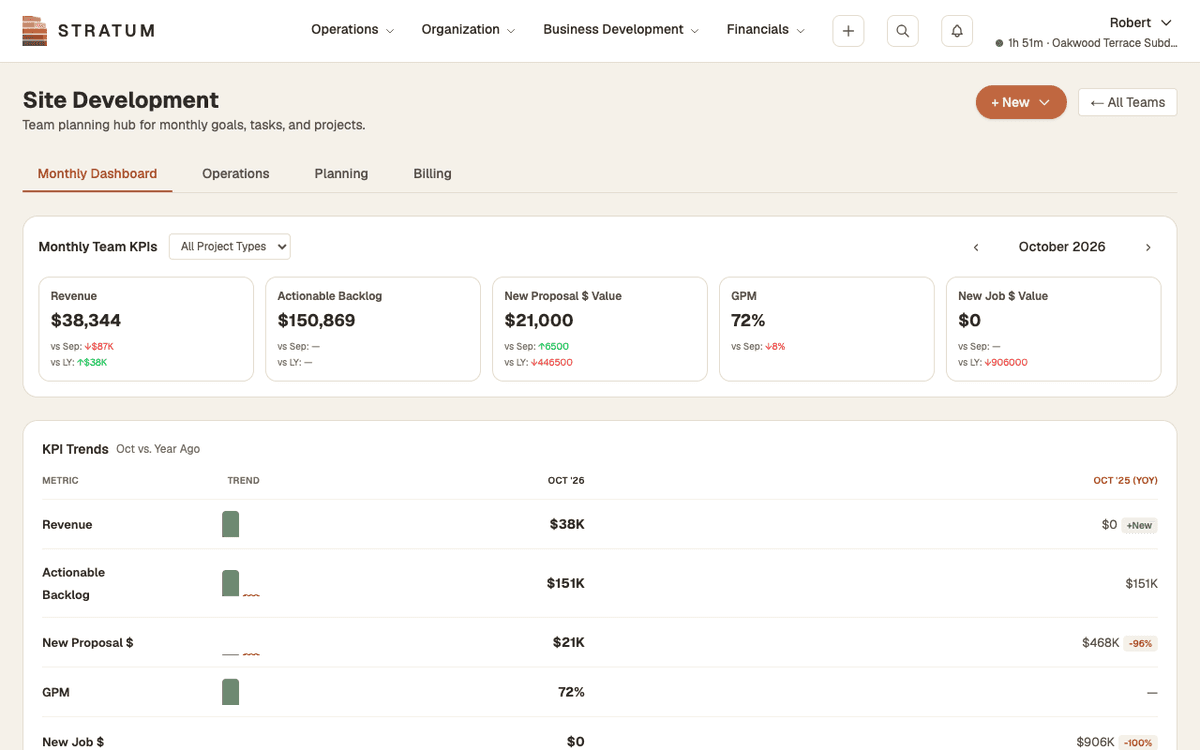
Revenue, margin and backlog against goal and last year, then every job in the division with its owner, its court and anything that needs you.
| Project | Client | Owner | Current milestone | Whose court | Budget used | Not billed | Flags |
|---|---|---|---|---|---|---|---|
| Canyon Ridge Subdivision | Ridgeline Homes | MTMarcus T. | Final plat | Our court | 62% | 31 h | 1 unassigned |
| Juniper Commons | Juniper Land Co. | MTMarcus T. | Preliminary plans | City · day 12 | 48% | — | Clear |
| Harbor Peak Lot 4 | Harbor Peak Builders | EVElena V. | Field survey | Our court | 35% | 12 h | Clear |
| Cedar Fork Trail | Cedar Fork City | PSPriya S. | Construction admin | Client | 91% | — | NTE 91% |
| Route 9 Corridor | Juniper Land Co. | MTMarcus T. | Survey & basemap | Sub · day 4 | 88% | 8 h | Clear |
| Mesa View Townhomes | Ridgeline Homes | EVElena V. | Site plan | Our court | 22% | — | Clear |
| Willow Bend Park | Cedar Fork City | PSPriya S. | Final design | City · day 14 | 70% | 6 h | Waiting 14 days |
| Sunrise Commercial Pad | Harbor Peak Builders | RLRosa L. | Topo & boundary | Our court | 15% | — | Clear |
Your key results
The few numbers this seat is measured on, visible every day, not once a year.
Sample data shown.

Your tools
Pick anyone on the team and their timecard opens: hours by project, a day-by-day account of what they worked on, utilization, overtime and entry lag. Approve it right there, or send it back with a reason.
The review starts with the scorecard, looks back, scores the five pillars, picks the one limiting factor and writes the action plan. This month’s plan is built from that action plan, so every priority traces back to a reason. Click through it.
| Metric | This quarter | Last quarter | Change | Target |
|---|---|---|---|---|
| Financial | ||||
| NSR | $512K | $468K | +$44K | $500K |
| NSR per FTE | $42.7K | $39.0K | +$3.7K | $41K |
| Net multiplier | 3.21 | 3.08 | +0.13 | 3.20 |
| Utilization | 68% | 65% | +3 pts | 80% |
| Write-offs | $6.2K | $9.8K | −$3.6K | $5K |
| Milestones over budget | 12% | 17% | −5 pts | 10% |
| Backlog, months | 5.3 | 5.0 | +0.3 | 5.0 |
| Actionable backlog, months | 3.1 | 3.4 | −0.3 | 3.5 |
| Operations | ||||
| Deliveries on time | 88% | 81% | +7 pts | 90% |
| Agency review cycles per project | 1.6 | 1.9 | −0.3 | 1.5 |
| Resubmittals — our own errors | 1 | 3 | −2 | 0 |
| Clients & BD | ||||
| Change orders authorized | $21.4K | $12.9K | +$8.5K | — |
| NSR from repeat clients | 74% | 70% | +4 pts | 70% |
| Proposals created | 19 | 14 | +5 | 15 |
| Proposal turnaround | 3.5 days | 5.0 days | −1.5 | 4 days |
| Team | ||||
| Big Rock weeks submitted | 92% | 85% | +7 pts | 95% |
How it rolls up
Margin you found out about late
A team measured on numbers it cannot see corrects a month after the month it needed correcting. Put your firm's numbers in and see what that lag is worth across a year.
Twelve sliders, no sign-up, nothing sent anywhere.
A 30-minute conversation about how your firm runs. If Stratum fits, we set it up with you.
Book a demo